Fixed Wing: Flow Analysis
Target Aircraft Information
- Fuselage length: 0.915[m]
- Wing span: 0.148[m]
- Reference area (main wing area): 0.28[m^2]
- Reference length (mean aerodynamic chord, MAC): 0.176[m]
Download Sample STEP File
Download the sample STEP file to follow along with this tutorial:
Sample CAD File
Step 1: Import CAD Geometry
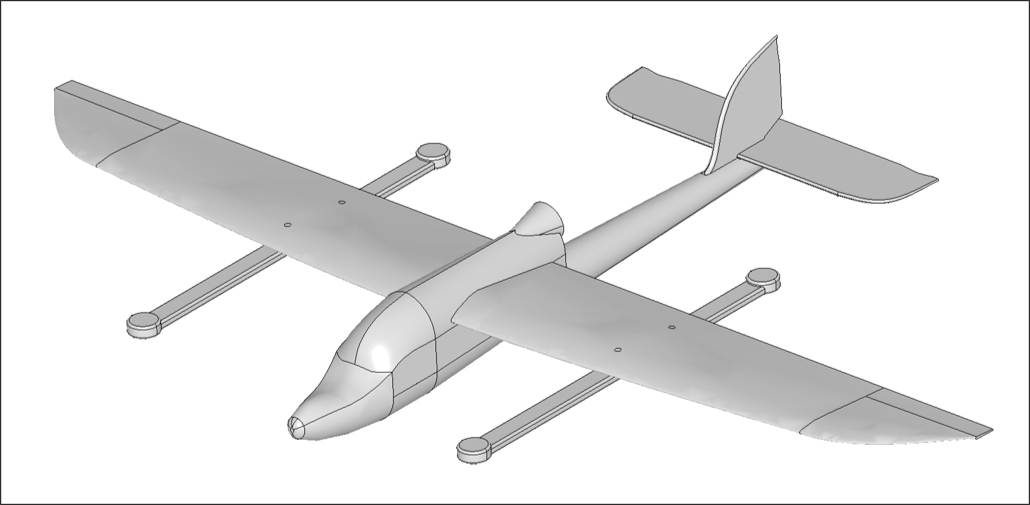
- Navigate to the Flow Analysis module
- Click the Import CAD button
- Select the
skysurfer_CFD.stepfile - Verify that the import completed successfully
Important Notes
- Geometry is directly reflected in the analysis without modification
- Ensure proper scale and units before importing
Step 2: Configure Flow Domain
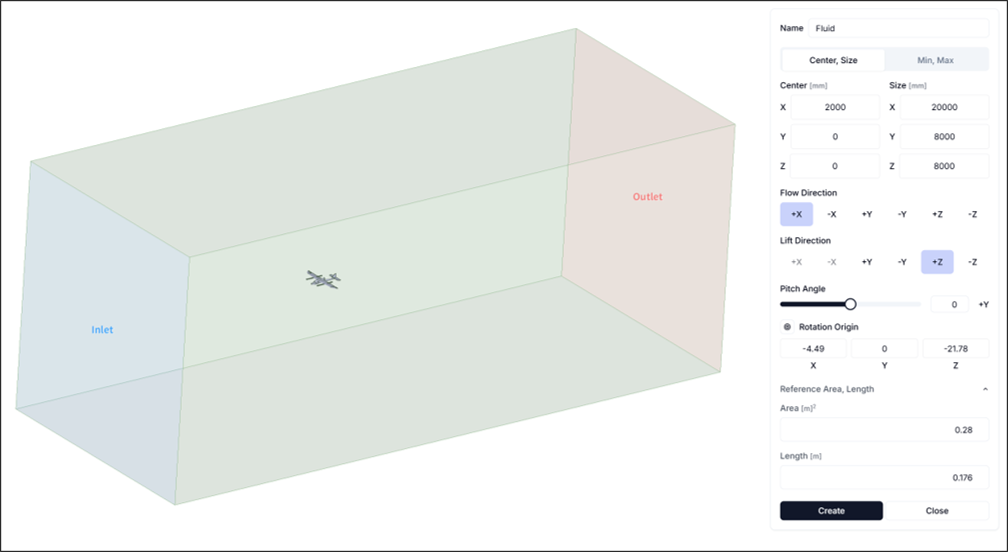
Set up sufficient flow space to properly capture flow characteristics.
- Flow Domain Center:
<2000, 0, 0> - Flow Domain Size:
<20000, 8000, 8000> - Reference Area and Length: Configure as follows
- Reference Area: 0.28[m^2]
- Reference Length: 0.176[m]
Step 3: Configure Simulation Settings and Run
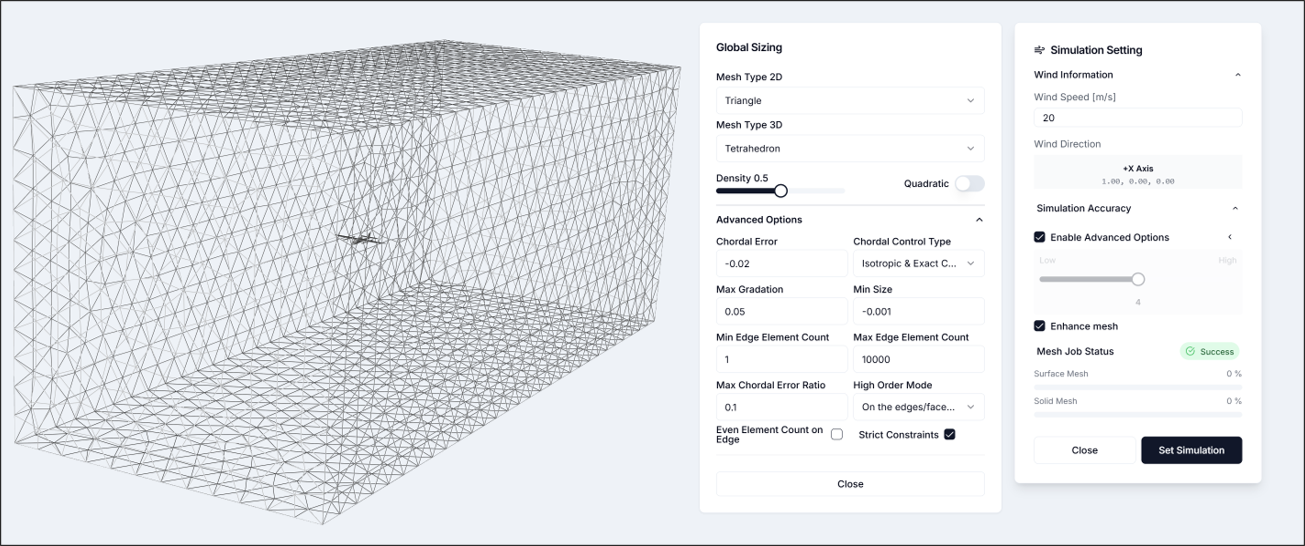
3.1. Simulation Settings
- Flow Velocity: 20[m/s]
- Simulation Accuracy: Enable advanced mode
- Maximum Growth Rate: 0.05
- Minimum Size: -0.001
- Other settings: Use defaults After configuring simulation settings, verify that the mesh has been generated as shown in the figure.
Step 4: Run Analysis
Set the number of cores freely and run the analysis. For the given CAD, it is recommended to use 16 or more cores.
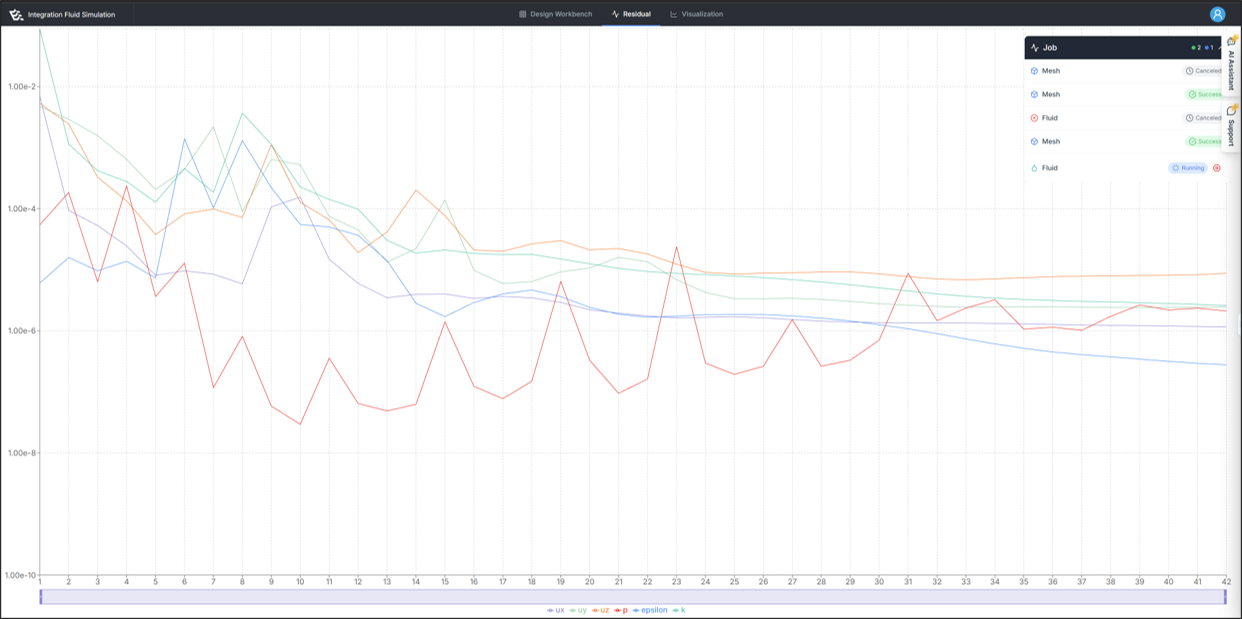
If the analysis runs successfully, residuals information will appear as shown in the figure.
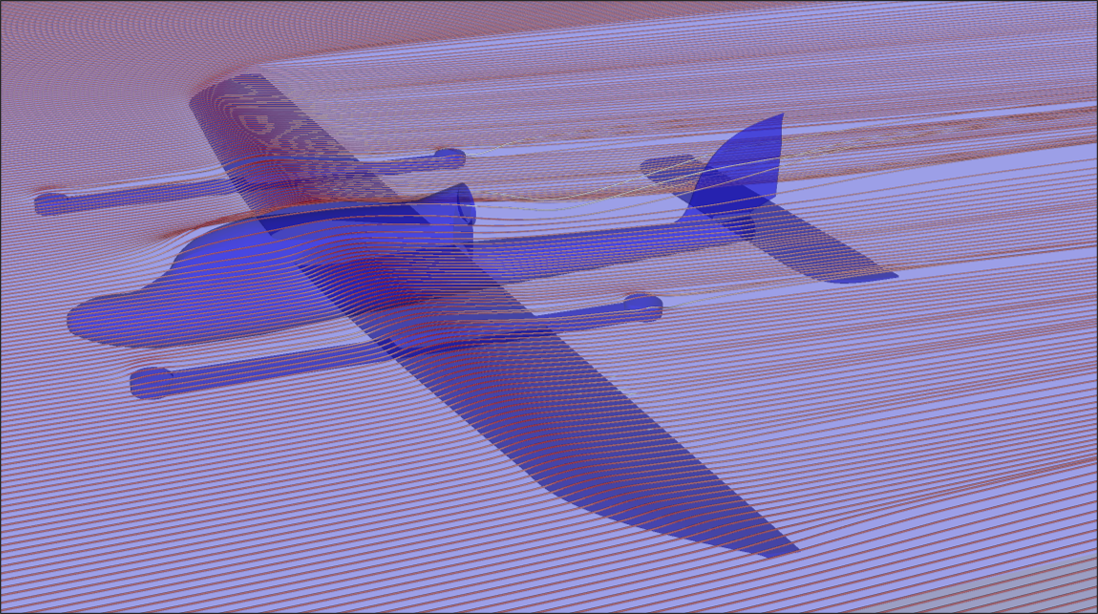
Step 5: Visualize Results
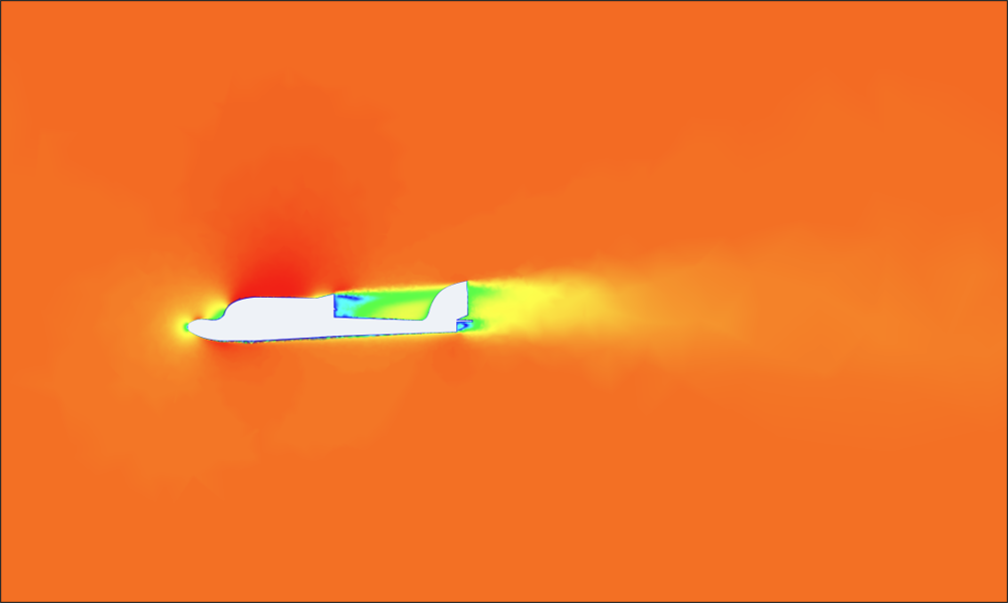
Result visualization is primarily used to review whether the flow analysis results are physically reasonable. In this analysis, we mainly examine the following phenomena:
- Wing tip vortex generation
- Wake formation behind the geometry
- Stagnation point occurrence
- Pressure distribution on the aircraft
Step 6: Review Reports
6.1. Aerodynamic Performance Analysis: Key Performance Indicators and Analysis Conditions
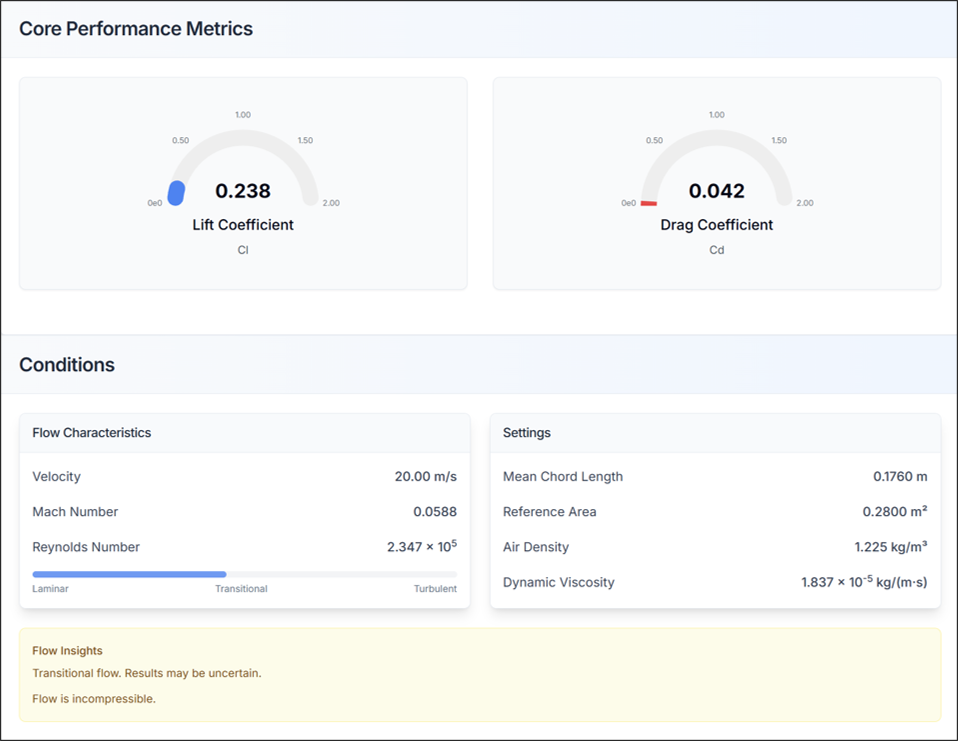
- Check lift coefficient (CL) and drag coefficient (CD)
- Verify that flow characteristics and simulation settings match the configured information
6.2. Aerodynamic Performance Analysis: System Forces and Moments
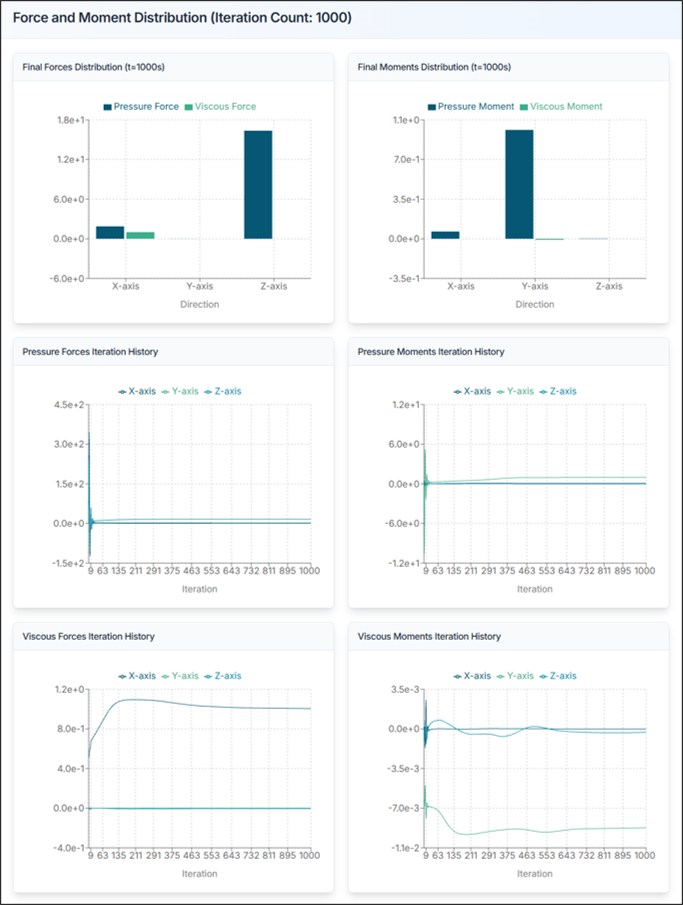
Review the forces acting on the entire aircraft.
- Fx, Fy, Fz: Forces in x, y, z directions [N]
- Mx, My, Mz: Moments about x, y, z axes [N·m]
Design Insights:
- Verify lift coefficient (CL) is within appropriate range
- Minimize drag coefficient (CD) for efficient design
- Check stability of pitching moment (My)
- Review whether wing tip vortex is not excessive
Aircraft Design Tips and Troubleshooting
1) If Lift is Insufficient
- Increase angle of attack
- Increase wing area
- Select high-lift airfoil
- Consider adding flaps or slats
2) If Drag is Excessive
- Optimize wing shape
- Design streamlined fuselage
- Reduce surface roughness
- Reduce induced drag with winglets
3) If Aircraft Stability is Problematic
- Adjust center of gravity (CG) position
- Adjust horizontal/vertical tail size
- Review wing position
- Adjust dihedral angle
4) CAD Import Failure
- Solution: Verify STEP file format is correct, check file size and complexity
5) Analysis Takes Too Long
- Solution: Optimize flow domain size, adjust mesh resolution, increase number of cores
6) Results Appear Unrealistic
- Solution: Check Reynolds number, review boundary conditions
7) Convergence Issues
- Solution: Adjust mesh resolution
Need Assistance or Have Questions?
Frequently Asked Questions: FAQ Link
Support Inquiries: support@everysim.io